Engage with suppliers and analyze responses
Include basic environmental questions as part of a RFx bid package
Add link: https://www.tspproject.org/docs/questionnaires/sustainability/, and instructions to complete an sustainability practices questionniare on TSP to your bid package information.
Provide step-by-step tutorial: Responding to an sustainability practices questionnaire
Invite suppliers to take assessment
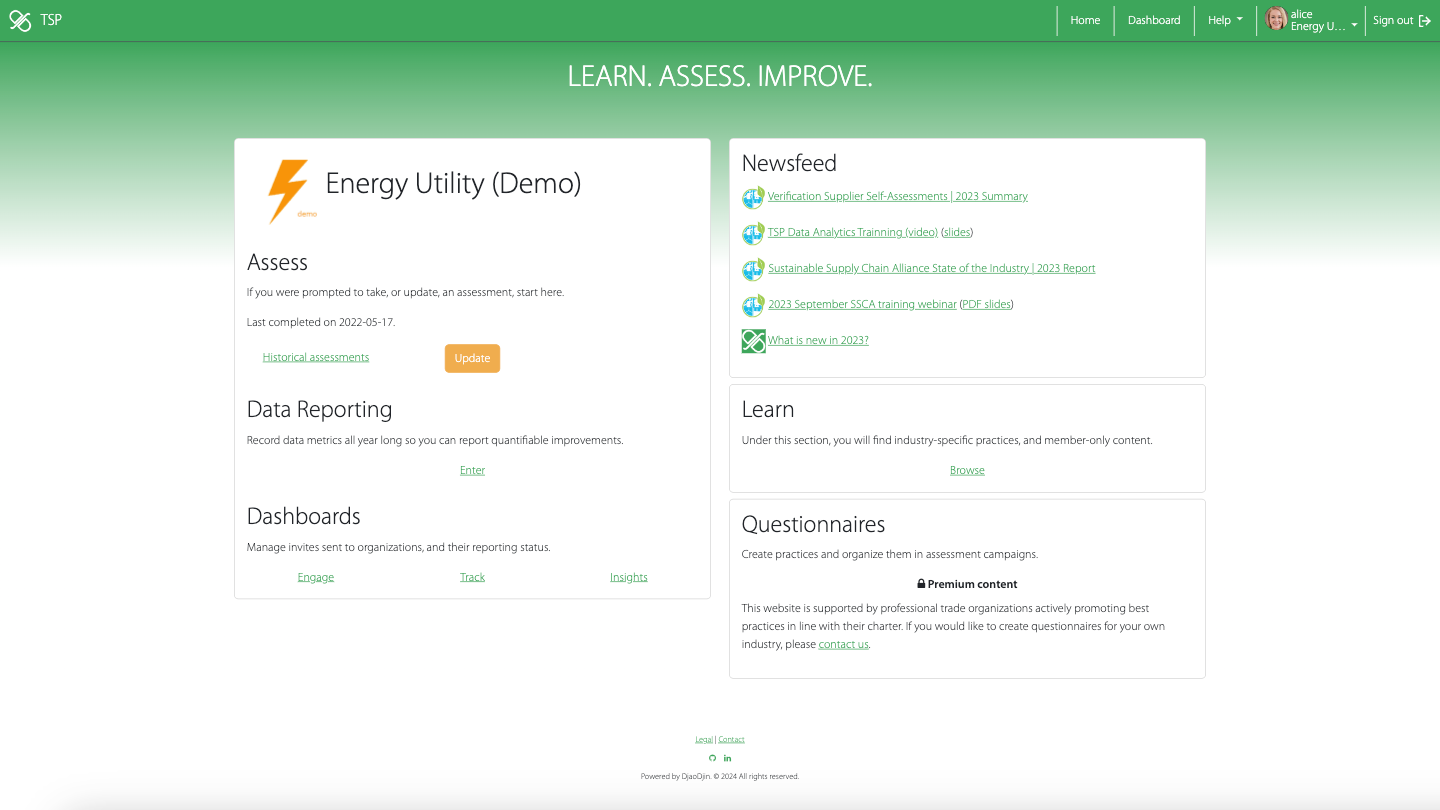
Go to the Engage dashboard.
Type the email address of the reporting entity (e.g. supplier) you wish to invite to to respond to a questionnaire in the search input field, and click Search.
Either the supplier has already been invited for the period, and you will have an option to re-send the invite, or the suppliers hasn't been invited for the period yet, and you will be able to send a first invite, after which they will be listed on the dashboard.
To go further, you might be interested to watch a video tutorial on How to use TSP dashboards to run an engagement campaign.
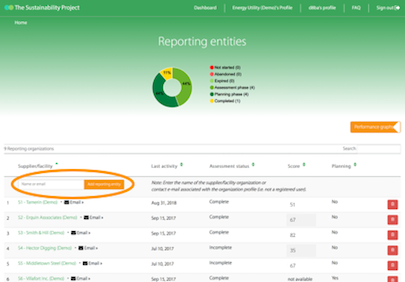
Download raw data for analytics
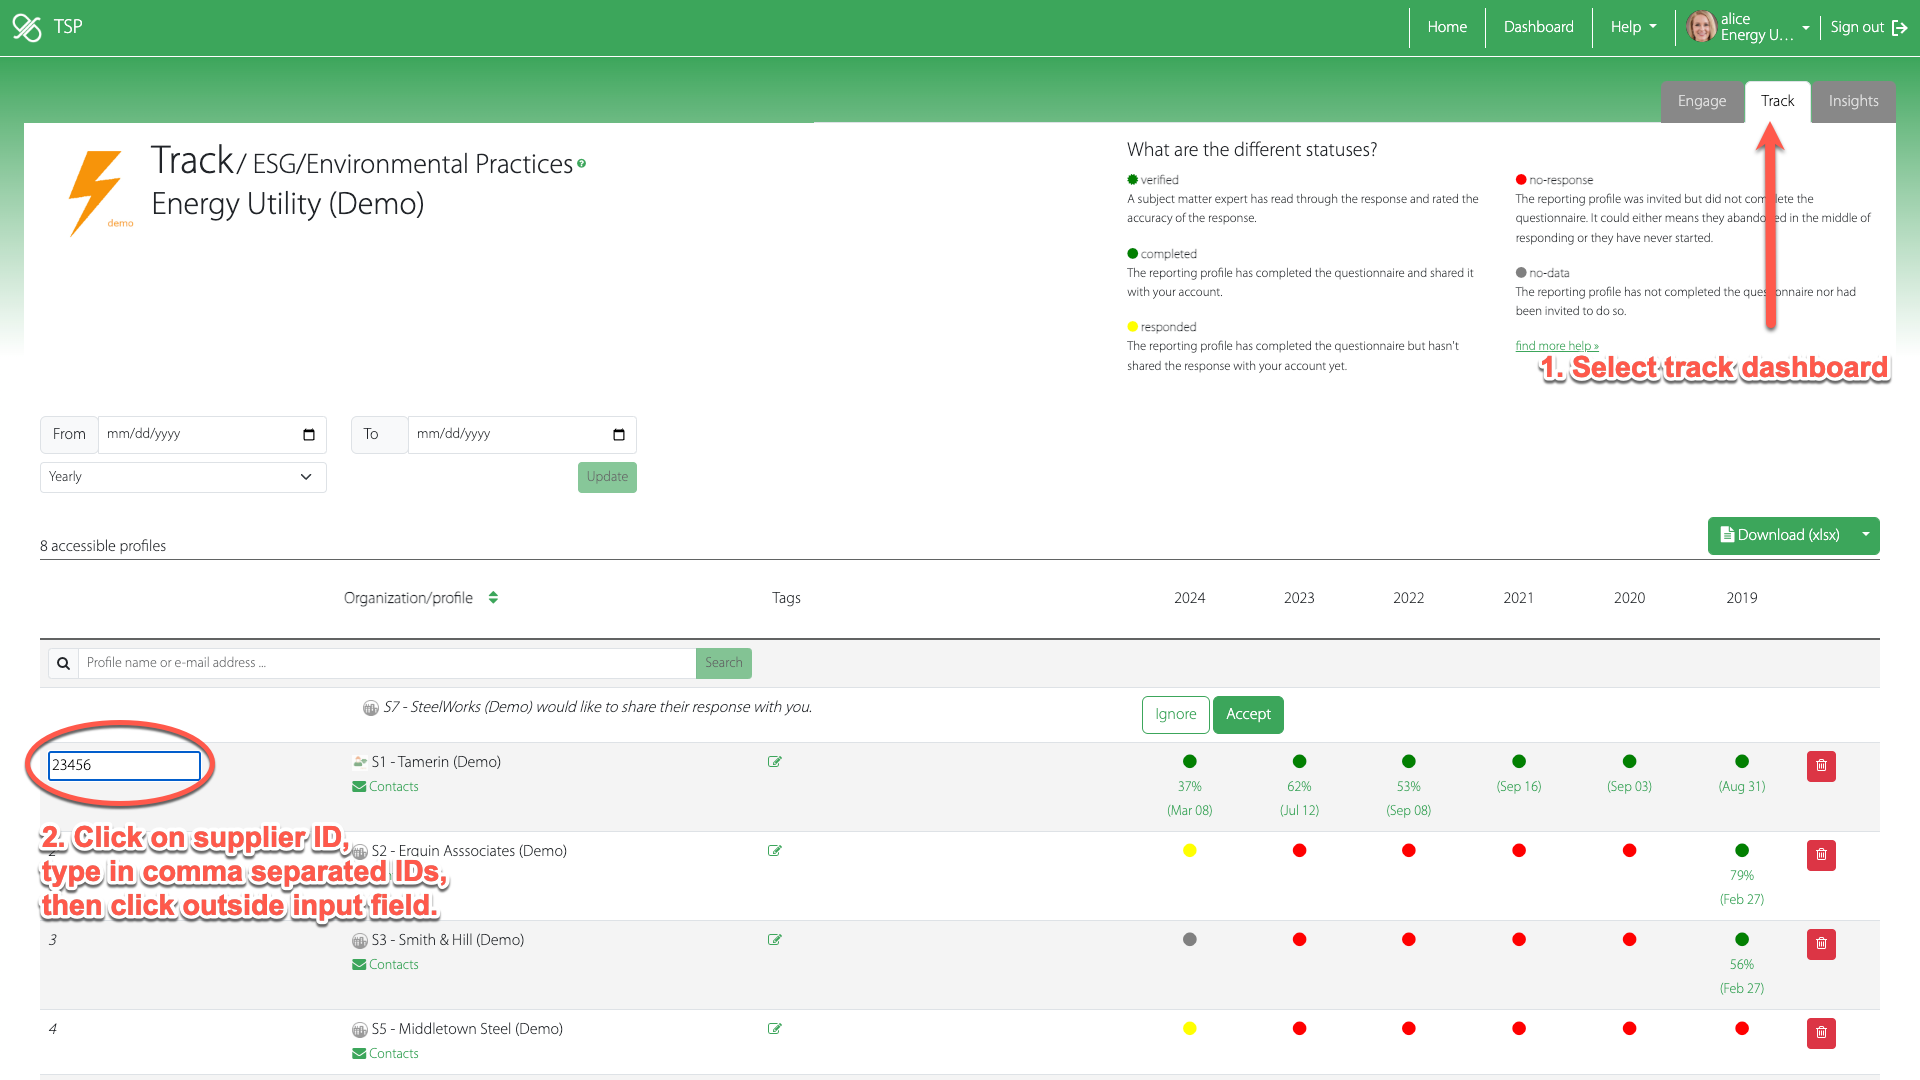
Attach your own vendor IDs
On the Track dashboard,
- Click on the supplier ID (on the left-side of supplier name).
- Enter the supplier ID you use internally in your company's Enterprise Resource Planning (ERP) system. You can enter comma separated IDs if the supplier profile covers multiple internal supplier records.
- Click outside the input field to save the changes.
- Need additional help?
- Contact us