Generate Report Chart
Introduction
In this tutorial, we are looking to create a high-level report about assessment findings and key information.
Have an Employee Code of Conduct
Calculate Scope 1 & 2 emissions
Of those suppliers, 60% have emissions reduction targets.
Create a "Have an Employee Code of Conduct" Chart
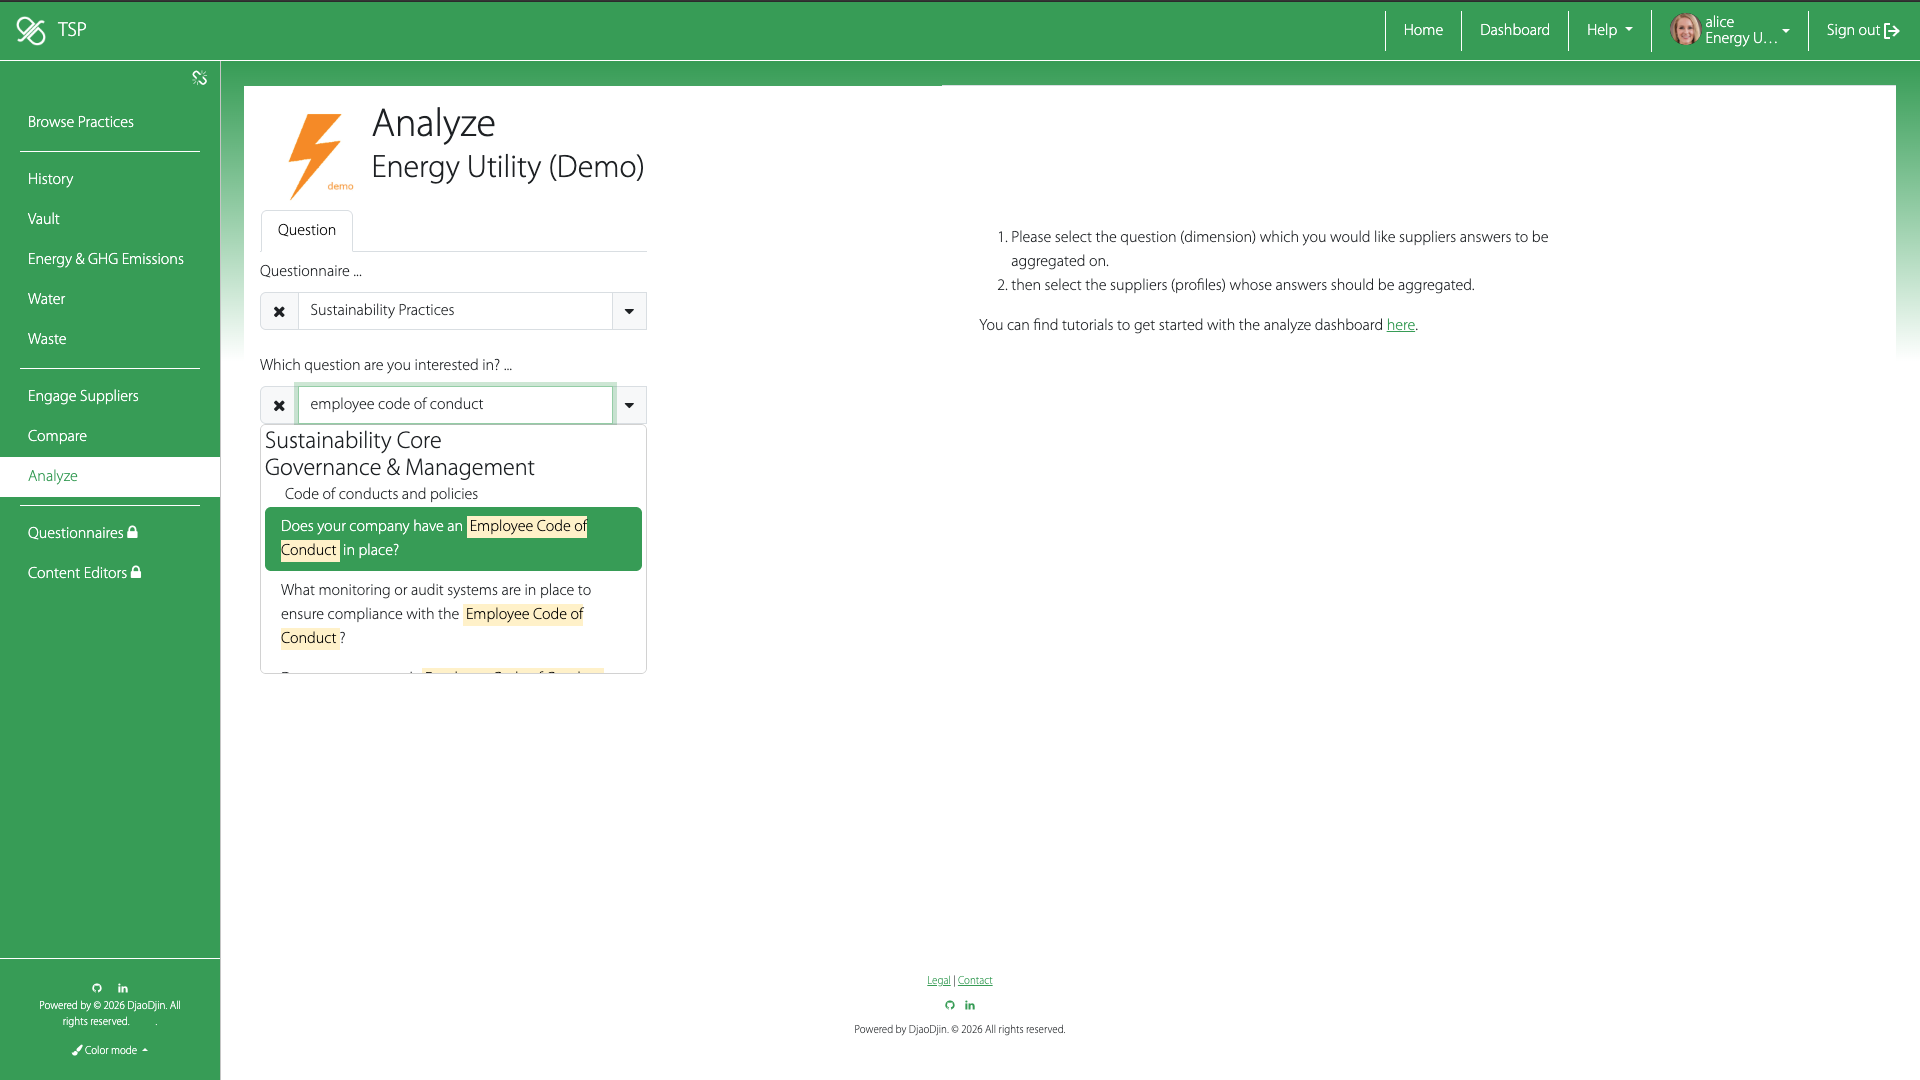
We are first going to generate the number of suppliers invited to take a Sustainability practices assessment in 2025 that have an employee code of conduct.
Have an Employee Code of Conduct
- Click Analyze in the left side bar
We first describe the question (dimension) we are interested in.
- Select Sustainability practices in the Questionnaire input
- Select Does your company have an Employee Code of Conduct in place? in the Which question are you interested in? input
- Since we are interested in 2025 responses, we are going to set the From date to 07/04/2025 (the date at which the 2025 updates to the Sustainability practices questionnaire are live) and set the To date to 12/31/2025 (the cut-off date after which responses are not included in the annual report).
- Click Next ».
Once we have described the responses we are interested in, we select the suppliers (profiles) we want to aggregate responses for.
- Select Accounts by affinity under Which accounts would you like to chart?
- Select Engaged in the drop-down that appeared.
- Use the same From and To dates as above (07/04/2025 - 12/31/2025) for suppliers that were invited in 2025.
- Click Add.
We can then click on Download (.xlsx) to export the aggregated numbers as a table we can use to re-create charts in our favorite tool.
Create a chart for suppliers that "Calculate Scope 1 & 2 emissions"
We are going to create a query to compute the percentage of suppliers that have a Scope 1 GHG emissions reduction target amongst the suppliers that report calculating scope 1 & 2 emissions and that I invited in 2025.
Calculate Scope 1 & 2 emissions
Of those suppliers, 60% have emissions reduction targets.
We can only aggregate on a single question (dimension), so we will use the question "Does your organization have a Scope 1 GHG Emissions reduction target in place? (ex: "Reduce Scope 1 emissions by 50% by 2040 from a 2020 baseline year through fleet electrification.")", and select suppliers (profiles) we invited and that entered an amount for Total Scope 1 GHG Emissions and Total Scope 2 GHG Emissions.
The number of profiles returned divided by the number of suppliers invited will give us the percentage of suppliers that Calculate Scope 1 & 2 GHG emissions.
Here are the step-by-step instructions to get the percentage of suppliers which Calculate Scope 1 & 2 GHG emissions that have a Scope 1 GHG Emissions reduction target.
- Click Analyze in the left side bar
- Select Sustainability practices in the Questionnaire input
- Select Does your organization have a Scope 1 GHG Emissions reduction target in place? (ex: "Reduce Scope 1 emissions by 50% by 2040 from a 2020 baseline year through fleet electrification.") in the Which question are you interested in? input
- Set From date to 07/04/2025, and To date to 12/31/2025. (leave the period empty as we are aggregating over the whole period Jul-Dec 2025).
- Click Next ».
Once we have described the responses we are interested in, we select the suppliers we want to aggregate their responses.
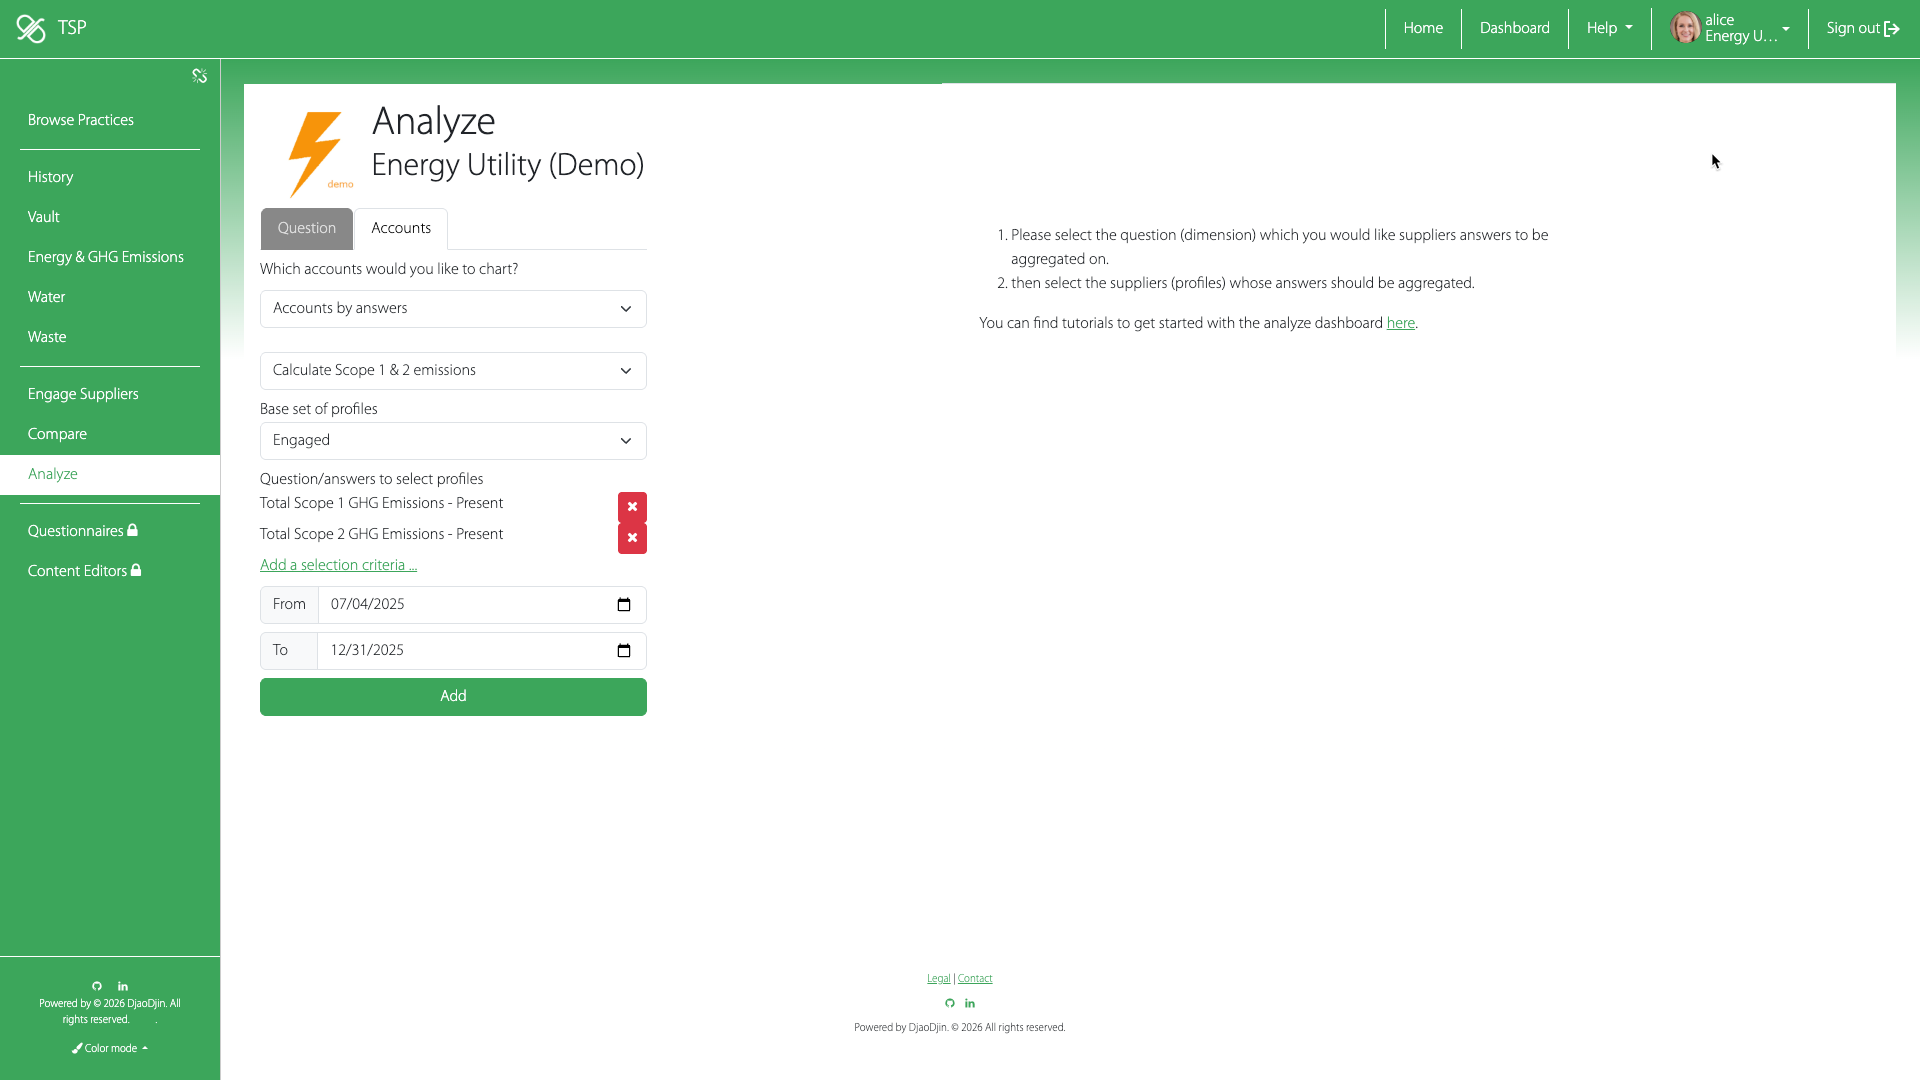
- Select Accounts by answers under Which accounts would you like to chart?
- Enter in the input under Name of the dataset: Calculate Scope 1 & 2 emissions, then click Create.
- Select Engaged for the Base set of profiles
- Select Sustainability practices in the Questionnaire input
- Enter in the inpput under Question/answers to select profiles: Total Scope 1 GHG Emissions.
- Select Present for the Pick answer you are looking for to "Total Scope 1 GHG Emissions" ...
- Click the Add a selection criteria link
- Replace the input under Question/answers to select profiles by: Total Scope 2 GHG Emissions.
- Select Present for the Pick answer you are looking for to "Total Scope 2 GHG Emissions" ...
- Use the same From and To dates as previously done (07/04/2025 - 12/31/2025).
- Click Add.
After the donut chart appears we can mouse over it to obtain the number of "Yes" and "No" answers. The sum of "Yes" and "No" gives us the number of suppliers that Calculate Scope 1 & 2 GHG emissions. To get the percentage of suppliers that Calculate Scope 1 & 2 GHG emissions, we need the total number of suppliers we invited that responded between 07/04/2025 and 12/31/2025. That is a number easily retrieved on the Engage dashboard directly.
- Click Engage suppliers in the left side bar, then browse to the Engage / Sustainability Practices tab (if you are running multiple questionnaires on TSP).
- Set the From date to 07/04/2025, and the To date to 12/31/2025.
- Click Update.
- Click the toggle total count (Nb) so charts are reporting number of suppliers instead of percentages.
- Browse the outer circle in the Engagement Status(Nb) to get the number of supplier that Completed a response.
We can now calculate the percentage of suppliers that Calculate Scope 1 & 2 emissions, and of those suppliers, the percentage that have Scope 1 emissions reduction targets.
| Answers "Yes" in "Scope 1 reduction target" chart | Y1 |
|---|---|
| Calculate Scope 1 & 2 emissions (Sum of all answers in "Scope 1 reduction target" chart) | Y1 + N1 |
| Total supplier responses ("Completed" in "Engagement Status(Nb)" chart) | T |
The Sustainability practices also contains a question "Does your organization have a Scope 2 GHG Emissions reduction target in place? (ex: "Reduce Scope 1 emissions by 50% by 2040 from a 2020 baseline year through fleet electrification.")". We are going to repeat the process above to calculate the percentage of suppliers that Calculate Scope 1 & 2 emissions, and of those suppliers, the percentage that have Scope 2 emissions reduction targets.
| Answers "Yes" in "Scope 2 reduction target" chart | Y2 |
|---|---|
| Calculate Scope 1 & 2 emissions (Sum of all answers in "Scope 2 reduction target" chart) | Y2 + N2 |
| Total supplier responses ("Completed" in "Engagement Status(Nb)" chart) | T |
A quick sanity check - Y1 + N1 should equal Y2 + N2 as both compute the number of suppliers that calculate Scope 1 & 2 emissions.
We will calculate the average of Y1 (Of those suppliers that have Scope 1 emissions reduction targets) and Y2 (Of those suppliers that have Scope 2 emissions reduction targets) for the number to plug in "Of those suppliers, X% have emissions reduction targets."
| Calculate Scope 1 & 2 emissions | 100 * SUM(Y1 + N1) / T |
|---|---|
| Of those suppliers, X% have emissions reduction targets. | 100 * AVERAGE(Y1, Y2) / SUM(Y1 + N1) |
- Need additional help?
- Contact us